ARM and Networking
Collecting data
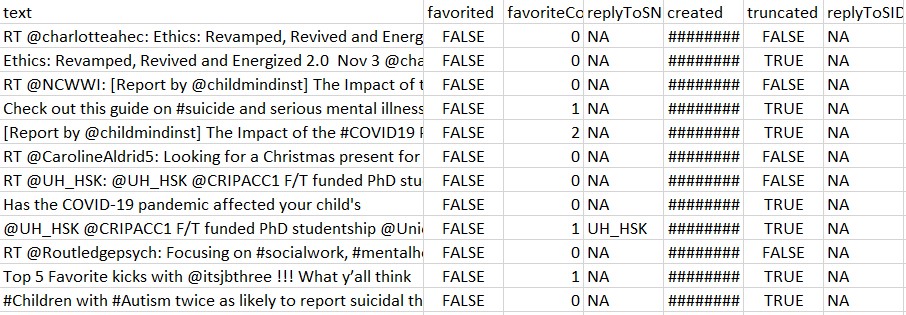
For ARM we need text data. The library tweetR is used to extract the tweets for the hashtag provided by the user.For this the tweets containing mental health and social work are extracted from Twitter using its API. The dataframe consists of a lot of unwated columns.
Cleaning and formatting the dataset to the required format
The code to create clean and format the datasets can be found here
There are a lot of unwated columns in the dataframe. Only the text column is needed to perform ARM. The next important step is to convert the dataframe into a transaction dataset. In ARM, there are three ways to represent the transaction data,it should either be in the basket, single or sparse format. Sparse is not used that often. For this project, the basket format is used. In the basket format, each row is a different transaction and there are not repetitions in the a particular transaction.
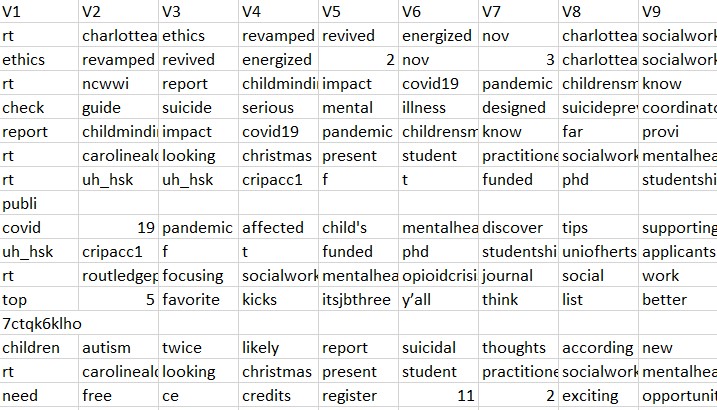
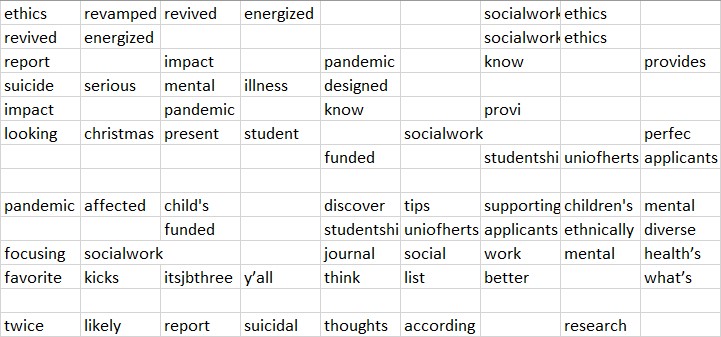
For cleaning, all the stopwords, digits,hyperlinks and unicodes for emojis are removed and punctuations and tokenizations are applied on the dataset. Now, the actual transaction data in the basket format that needs to be used is achieved.
What is Association Rule Mining?
It is an Unsupervised Learning Technique. It is a discovery based model. ARM looks for associations and relations in qualitative data. The most commom example is the Market Basket example (Kumar,2008) in which each row is considered as a transaction.
Many applications of ARM include:
- Image identification
- Text Analytics: like Twitter data
- Click streams
- Bio data : binding sites, AA's in proteins
What is a Rule? What are the different types of Rules?
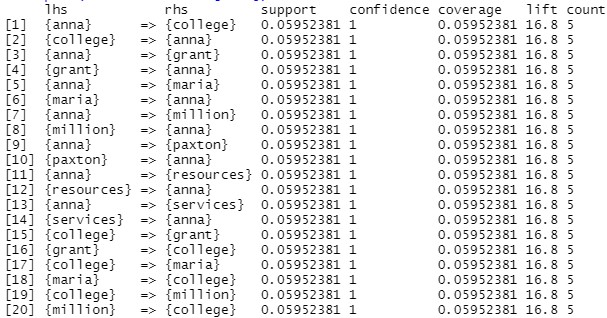
A rule is a set of correlations. The rule defines the threshold values for the associations.
The different types of rules are :
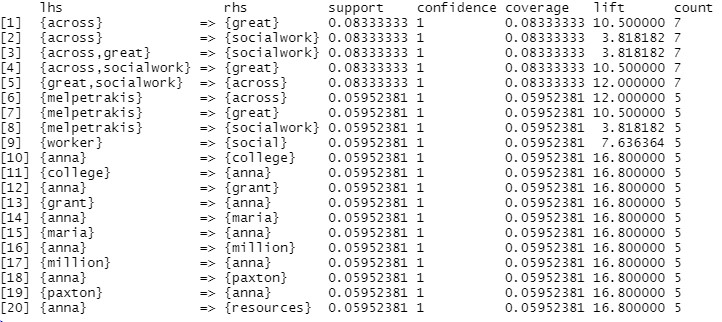
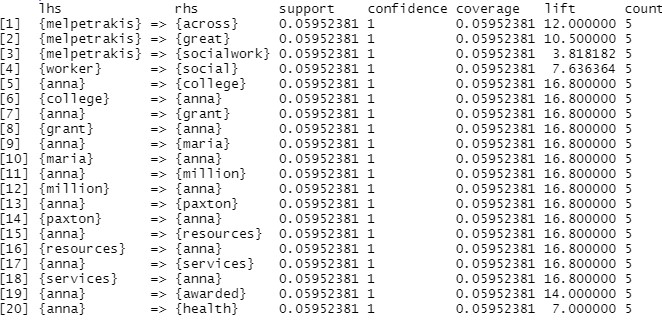
1. Support - Support is an indication of how frequently the itemset appears in the dataset.The support of X with respect to T is defined as the proportion of transactions in the dataset which contains the itemset X. The Support can be calculated as Support: Sup(X,T)=P(X,T)
2. Confidence - Confidence is an indication of how often the rule has been found to be true.The confidence value of a rule, X -> Y , with respect to a set of transactions T, is the proportion of the transactions that contains X which also contains Y. The confidence can be calculated as : Confidence: Conf(x,y)=P(x,y)/P(x)
3. Lift - It is the ratio of confidence to support.
-- If the rule had a lift of 1, it would imply that the probability of occurrence of the antecedent and that of the consequent are independent of each other. When two events are independent of each other, no rule can be drawn involving those two events.
-- If the lift is > 1, that lets us know the degree to which those two occurrences are dependent on one another, and makes those rules potentially useful for predicting the consequent in future data sets.
-- If the lift is < 1, that lets us know the items are substitute to each other. This means that presence of one item has negative effect on presence of other item and vice versa.
The value of lift is that it considers both the support of the rule and the overall data set.
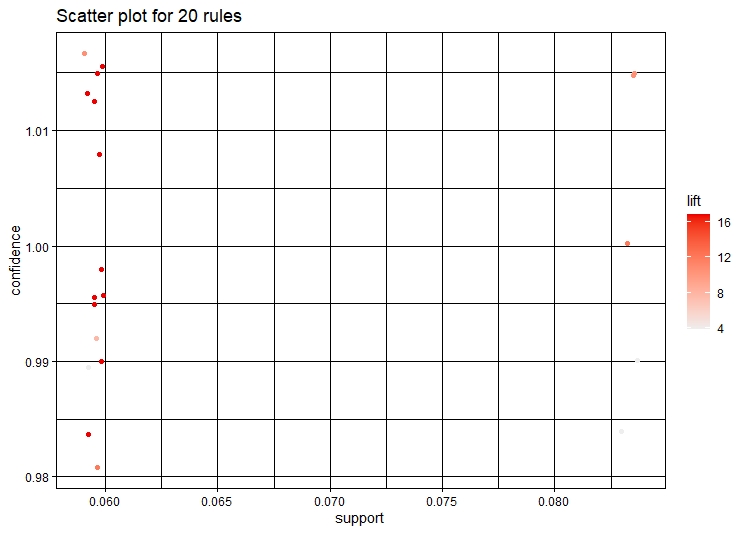
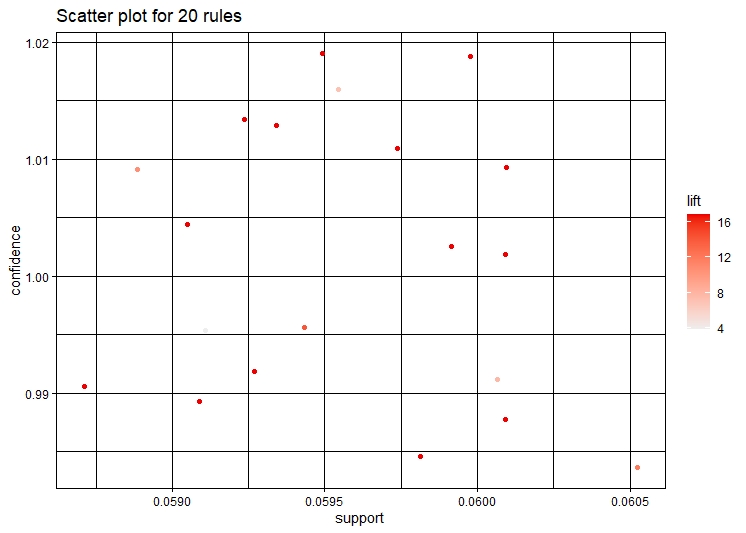
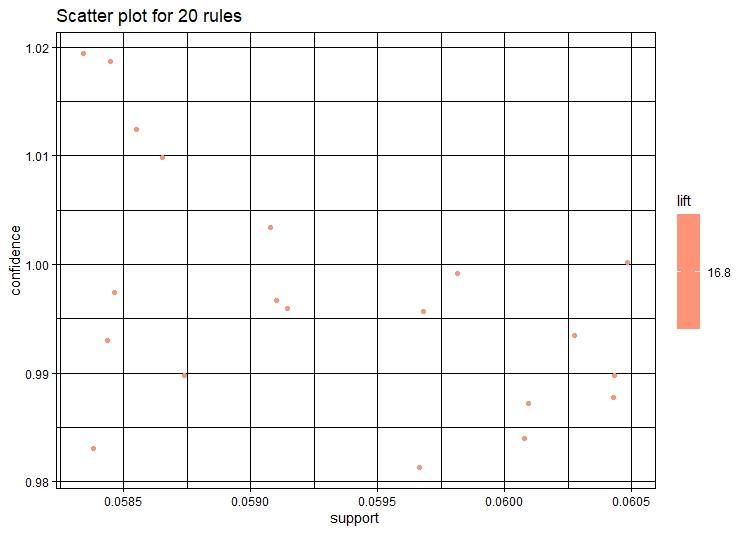
Visualization of the Rules
The code to create Visualizations can be found here
The frequency of the words in the tweets are plotted using a histogram.
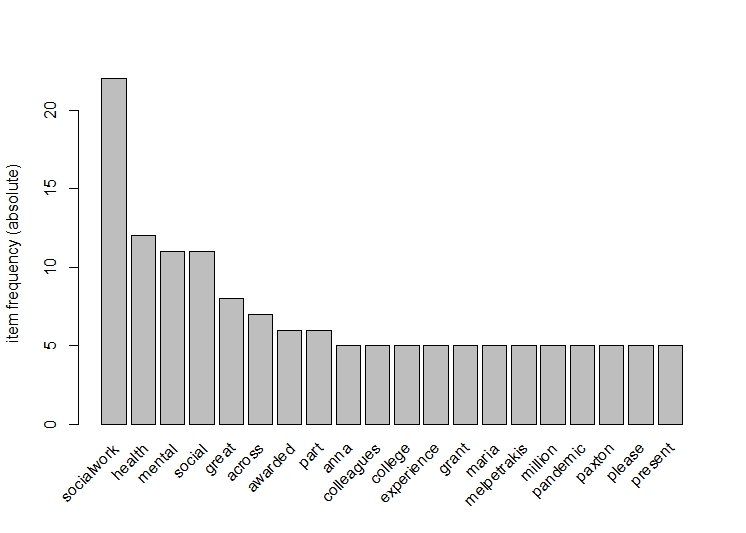
From the graph it can be seen that mental health and social work are common words in the tweets.The words in these tweets are social,great,awarded,pandemic,etc. This establishes that even pandemic is affecting people's mental health. This is the reason why there is a high volume of tweets related to these topics.
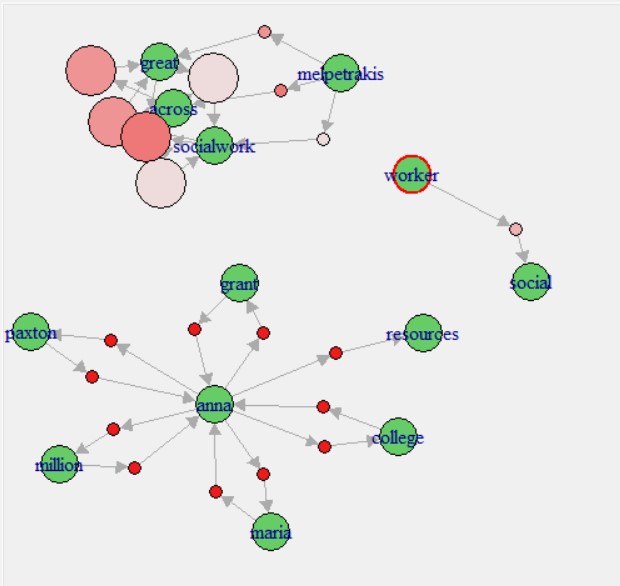
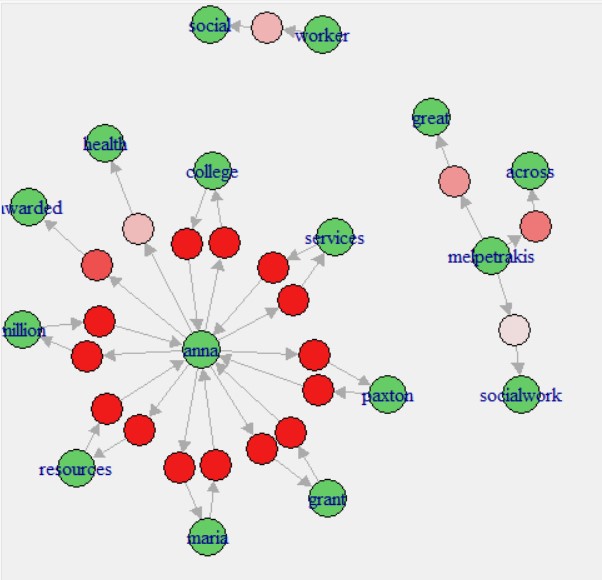
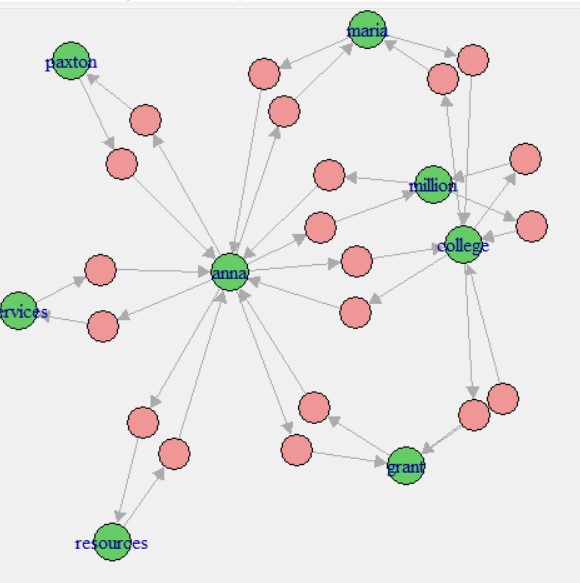
NetworkD3
Interactive Network Graphs are created using the NetworkD3 package in R. Transaction data needs to be transformed in a particular format with different parameters to be able to pass NetworkD3.The code to create NetworkD3 graphs can be found here
Conclusions
Firstly, when searched for the hashtag of mental health and social work, words like pandemic pop up in the frequently tweeted words. The open discussion about Mental health is a comparatively new discussion that has started to pop up. Mental health has been discussed even more in the pandemic. Twitter feels like an apt place where the youth has discussions about it.
Even words like college and community are frequently used as youth are comparatively more charged and vocal about topics like social work and mental health.