Clustering with Python
A snapshot of the dataset using CountVectorizer and TFidf Vectorizer can be seen below:
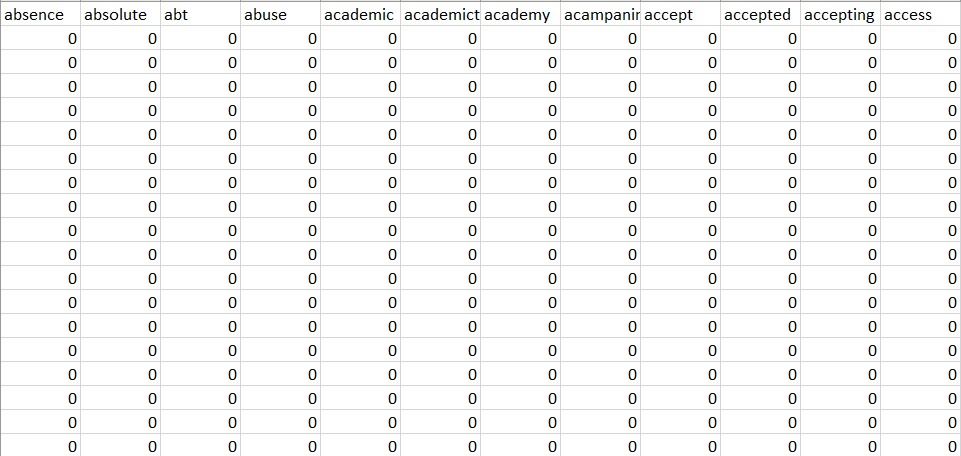
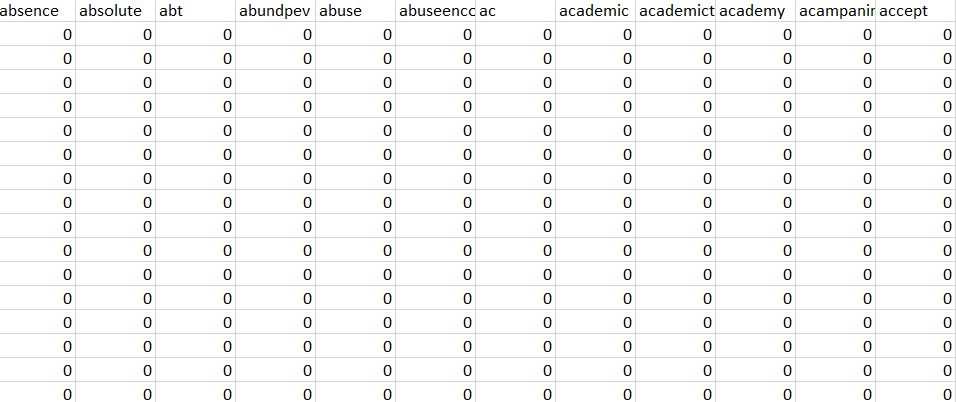
*The DTM can be improved
The code for finding the DTM can be found here
Finding the optimal number of clusters
To start with KMeans, the first thing that is required is the number of clusters. The Elbow method, the Silhoutte method and the Calinsky-Harabasz methods were used to obtain the optimal value of k.
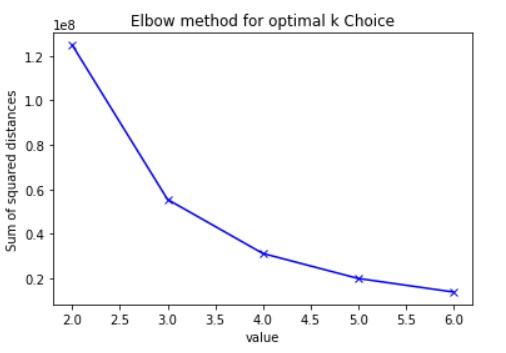
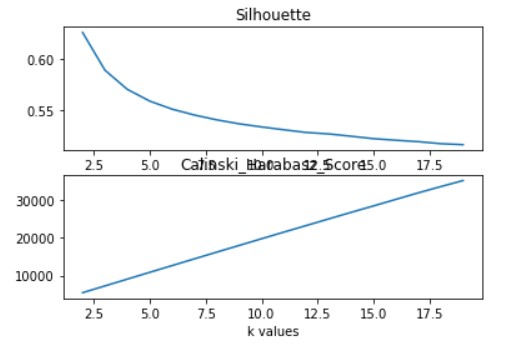
From the Elbow and Silhouette method it can be inferred that the k should be taken as 3,4,5
The code for finding optimal number of cluster can be found here
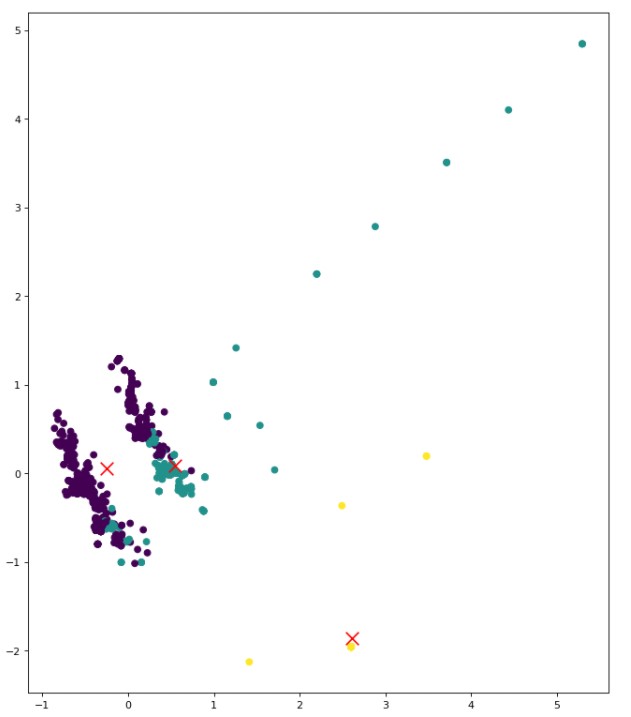
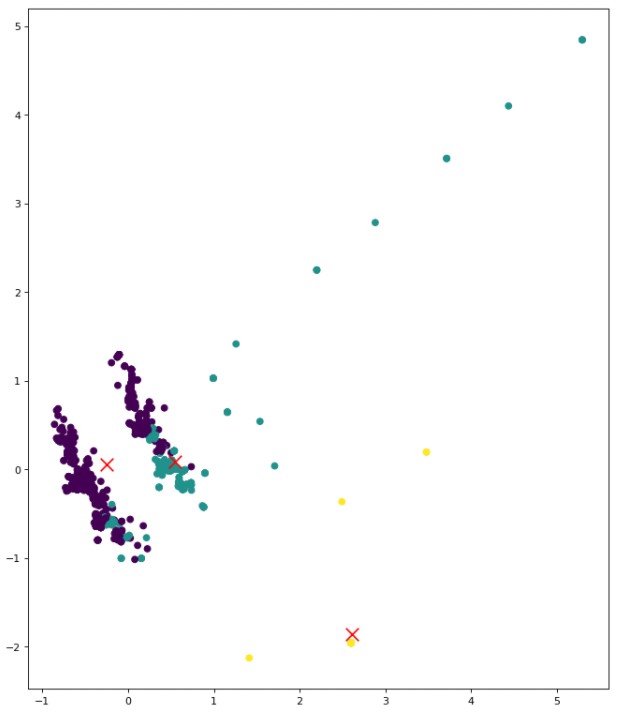
K Means Clustering
K means clustering is performed on the data, with the assumption that k is 3,4,5 (can be seen from the methods used above).
The code for K Means Clustering can be found here
The clusters for this data are overlapping, it maybe because many tweets might have similar words that correspond to different topics/ labels.This can still be improved.
Hierarchical Clustering
Euclidean distance method was used to plot a dendrogram in Python, with k = 4. It can be seen the clusters are very dense. It depicts the closely related words and as mentioned above there is a possibilty of similar words in different tweets.
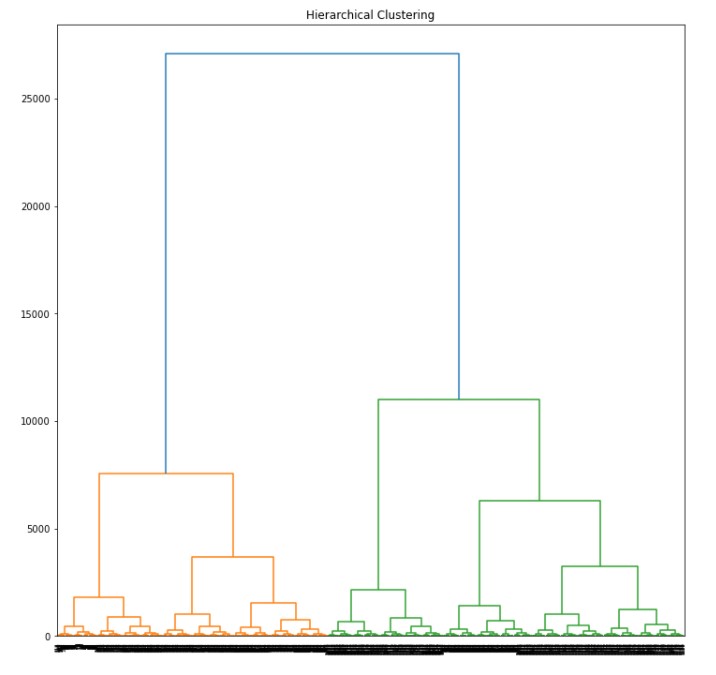
The code for calculating the Hierarchical Clustering can be found here
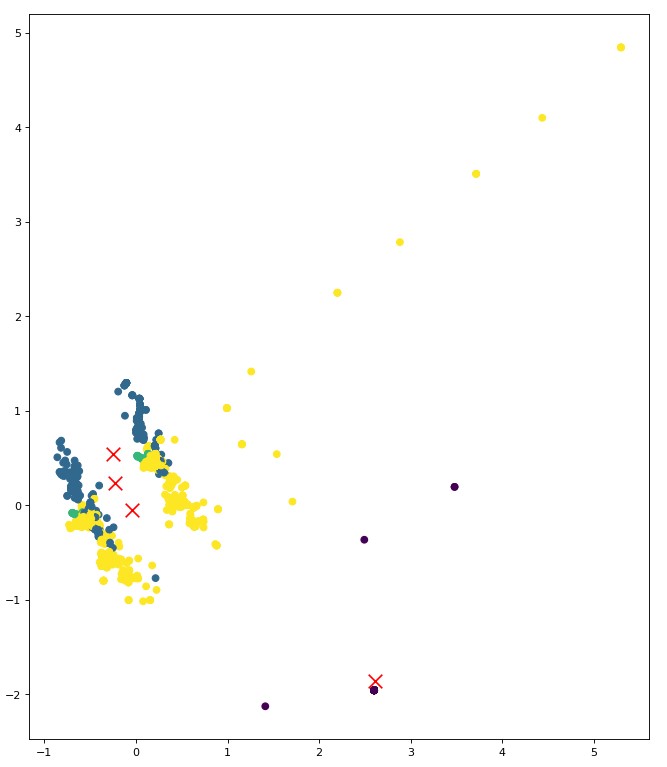
DBSCAN
It can figure out clusters of different shapes and sizes from massive data, which has outliers and noise.
The code for finding DBSCAN can be found here
Summary
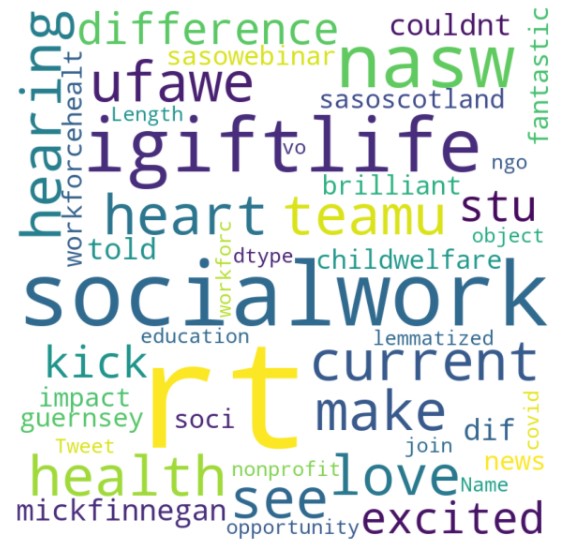
A csv files was created from the tweets using the hashtag socialwork. Different methods are used to find the optimal k value for creating clusters using K means. Hierarchical Clusutering is performed using the Euclidean Distance Measure. Because of the massive volume of the data and possibility of similar words in different tweets, the clusters are overlapping and not defined, it can be further improved.