Clustering with R
Finding the optimal number of clusters
To start with KMeans, the first thing that is required is the number of clusters. The Elbow method and the Silhouette method were used to obtain the optimal value of k.
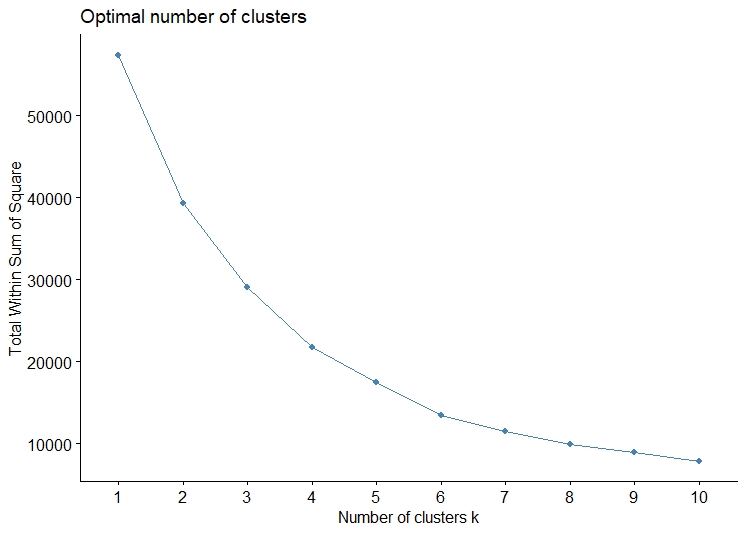
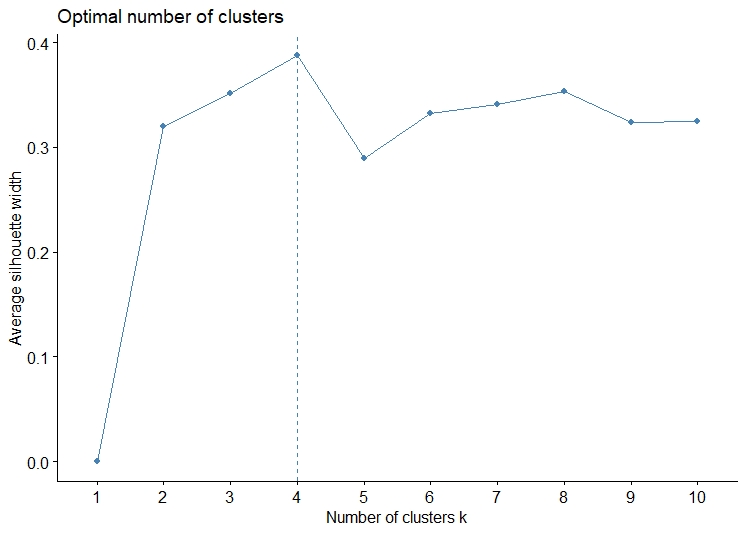
From the Elbow and Silhouette method it can be inferred that the k should be taken as 2,4,8.
The code for finding optimal number of cluster can be found here
K Means Clustering
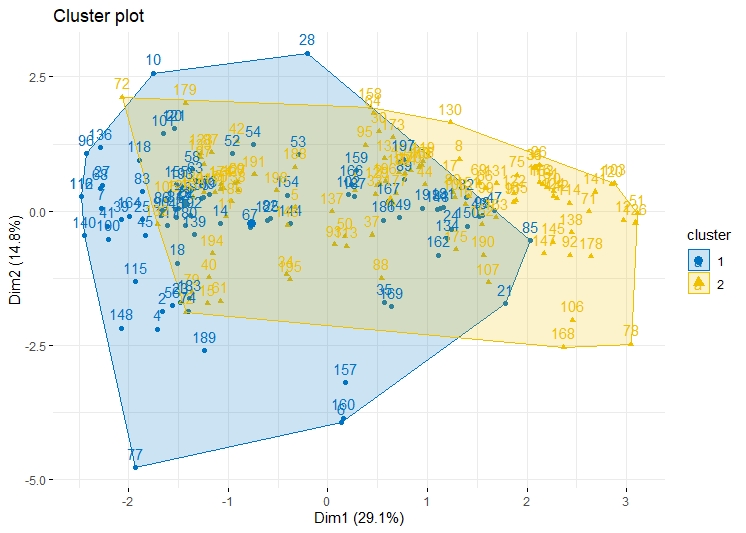
K means clustering is performed on the data, with the assumption that k is 2 (can be seen from the Elbow and Silhouette Method).
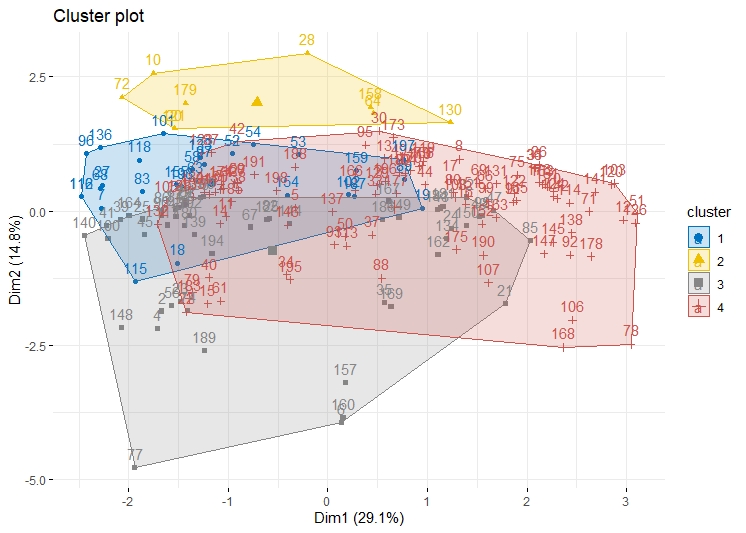
K means clustering is performed on the data, with the assumption that k is 4 (can be seen from the Elbow and Silhouette Method).
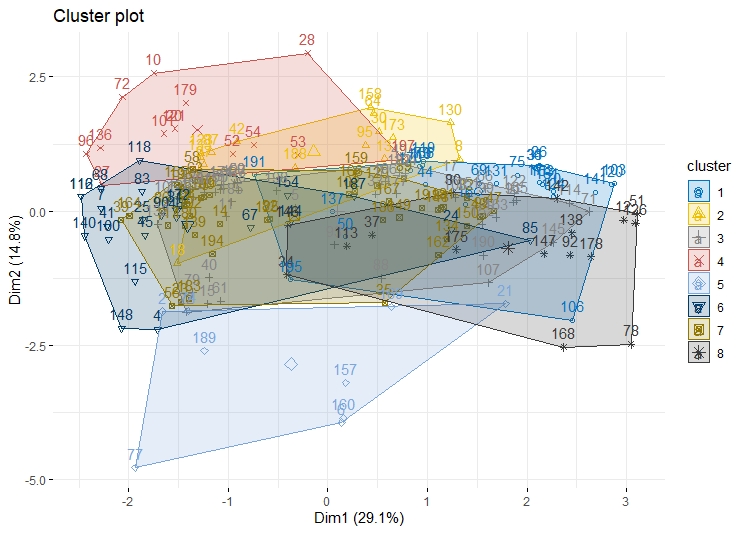
K means clustering is performed on the data, with the assumption that k is 8 (can be seen from the Elbow and Silhouette Method).
The code for K Means Clustering can be found here
The clusters for this data are overlapping, this can still be improved.
Calculating the distances
Different methods are used to plot the dendogram in R
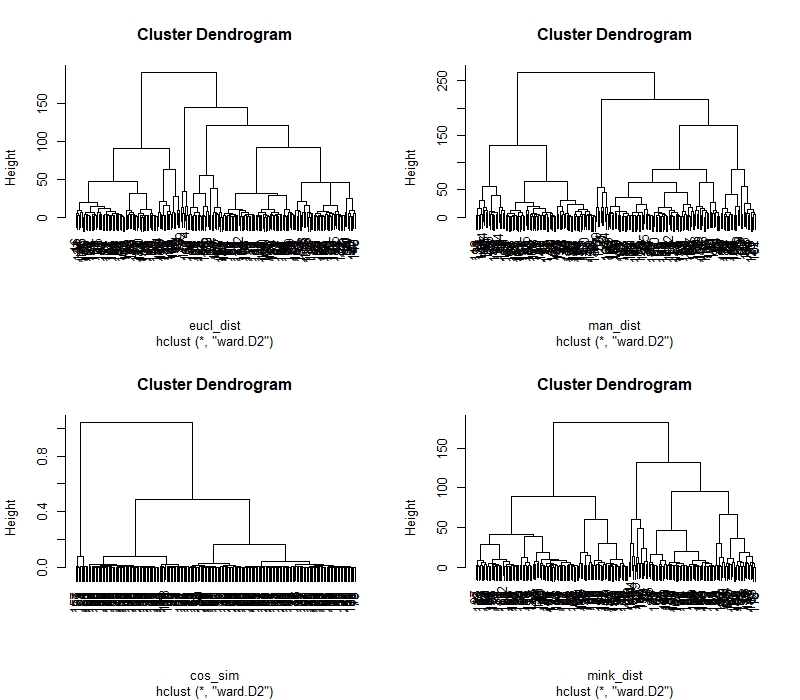
The links for different dendograms can be found below:
The code for calculating the distances can be found here
Predicting new category
Three new vectors are created, to predict which cluster that vector belongs to,distance of the vector from the cluster centers is calculated. It belongs to the cluster with the minimum distance, the distance method used is Euclidean. For this the vectors are created using the runif function of R. The values in the vector should be 1 and 2. In this vector, it predicts the cluster to be 4.
The code for predicting the clusters for the new vector can be found here
Summary
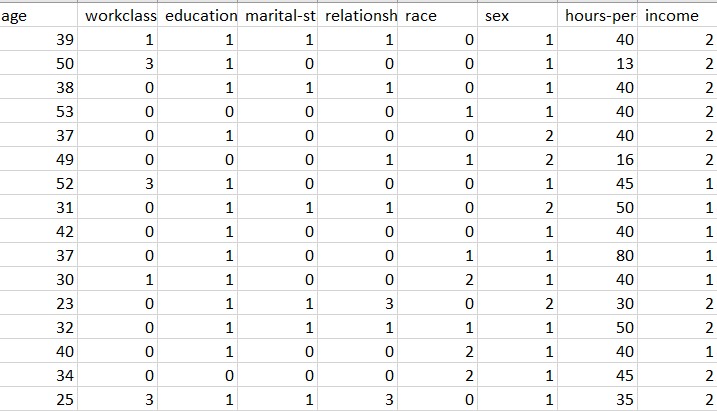
The dataset consists of just 8 columns and 198 rows. The label column is whether the person is rich or poor based on the various factors (other columns). The aim is to look for connections between different people based on their income.Clustering the dataset provided insights into that. The value of k = 2,4,8 was set for defining the number of clusters which was calculated using the Elbow method and Silhouette method. But from the K means clustering it can be seen that the clusters are overlapping and can be improved.