Naive Bayes
What is Naive Bayes
It is a classification technique based on Bayes Theorem with an assumption of independence among predictors. In simple terms, a Naive Bayes classifier assumes that the presence of a particular feature in a class is unrelated to the presence of any other feature. Naive Bayes model is easy to build and particularly useful for very large data sets. Along with simplicity, Naive Bayes is known to outperform even highly sophisticated classification methods.
Naive Bayes in R
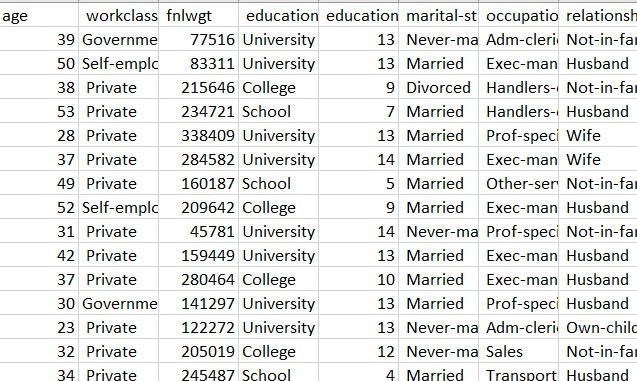
The naive bayes is created using record dataset in R. It is the same record dataset used for decision trees. The dataset has been downloaded from UCI Machine learning repository. The link for the source can be found here This dataset consists of various features like age, workclass, education, marital status, relationship, race, sex, hours per week. The label column contains the data of whether the person is rich (salary greater than or equal to 50k) or poor(salary less than $50k).
Cleaning and formatting the dataset to the required format
The code to create clean and format the datasets can be found here
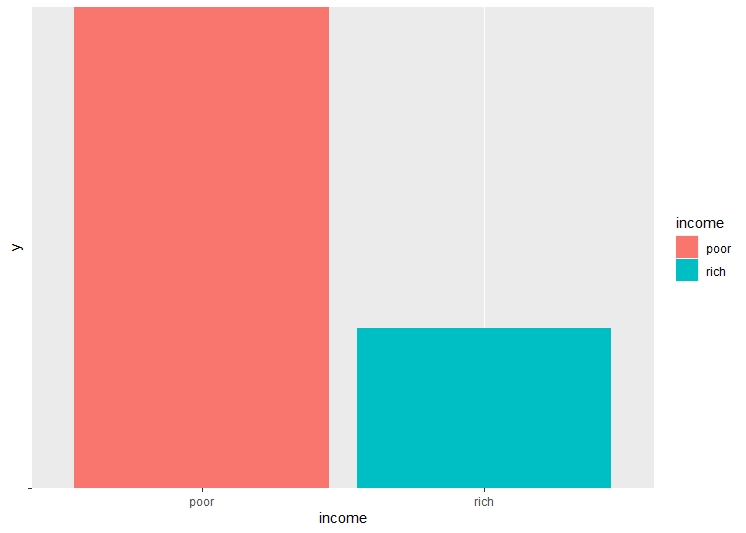
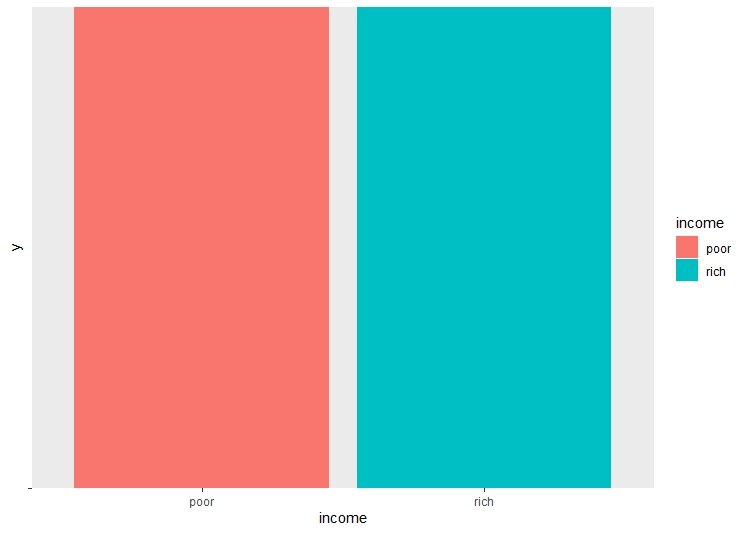
There are a lot of unwated columns in the dataframe. These columns are dropped from the dataframe, retaining only the necessary columns. The dataset is checked for NA values, and all the NA values are removed. Checking the balance of the dataset and label is very important before performing decision trees, as unbalanced dataset may lead to over or underfitting.
Model Building
The code to build the model can be found here
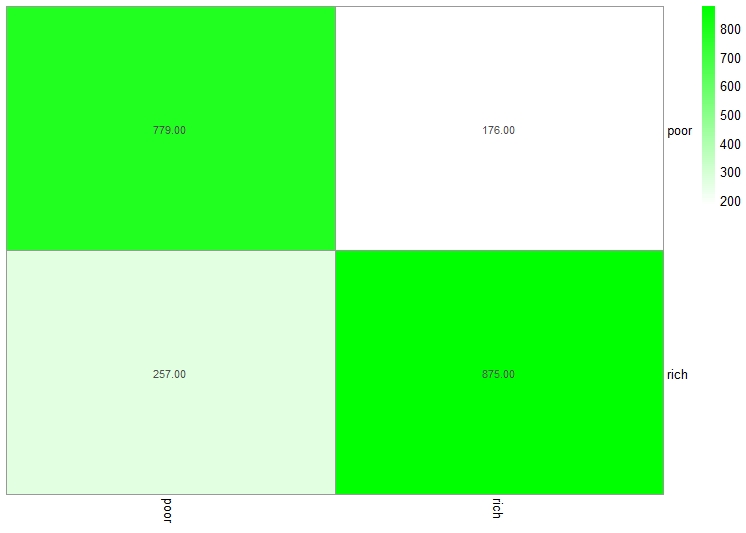
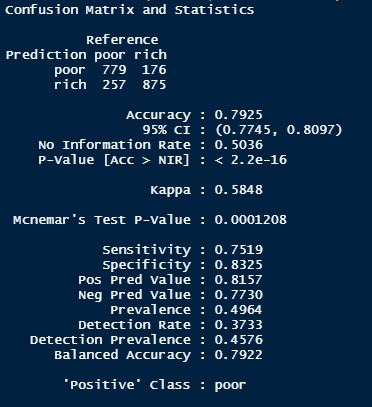
Before building the model, the dataset is split into training and testing sets. The split ratio is 0.75 of the total data in the training set and 0.25 data in the testing set. The naive bayes model is trained using the training dataset and then the model is tested using labels from the testing dataset
Conclusion
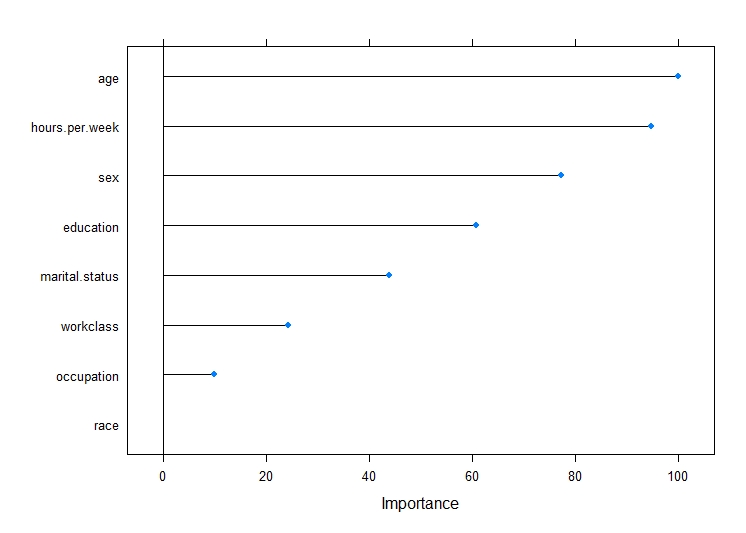
The intention was to perform naive bayes to help predict the income class of a person given the different features. The accuracy of the model (79%) is pretty decent in predicting the income group. According to the above graph, the key features to predict the income group are age, hours worked per week and sex. It makes sense that the variable age and hours worked per week have a significant impact on income.