SVM
What is SVM
The objective of the support vector machine algorithm is to find a hyperplane in an N-dimensional space(N — the number of features) that distinctly classifies the data points. To separate the two classes of data points, there are many possible hyperplanes that could be chosen. The objective is to find a plane that has the maximum margin, i.e the maximum distance between data points of both classes. Maximizing the margin distance provides some reinforcement so that future data points can be classified with more confidence.Support vectors are data points that are closer to the hyperplane and influence the position and orientation of the hyperplane. Using these support vectors, the margin of the classifier is maximized.
SVM in Python
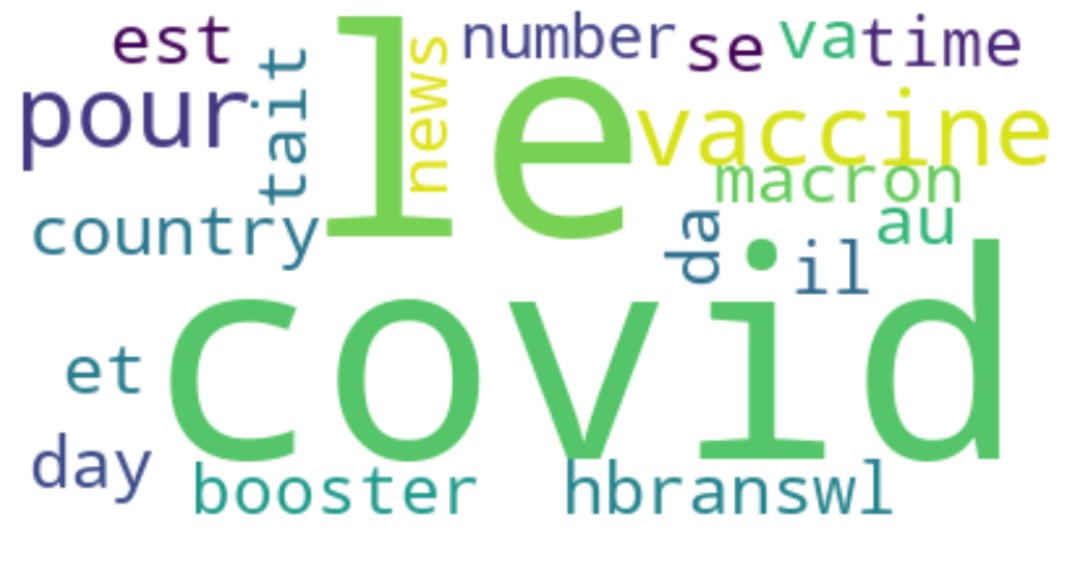
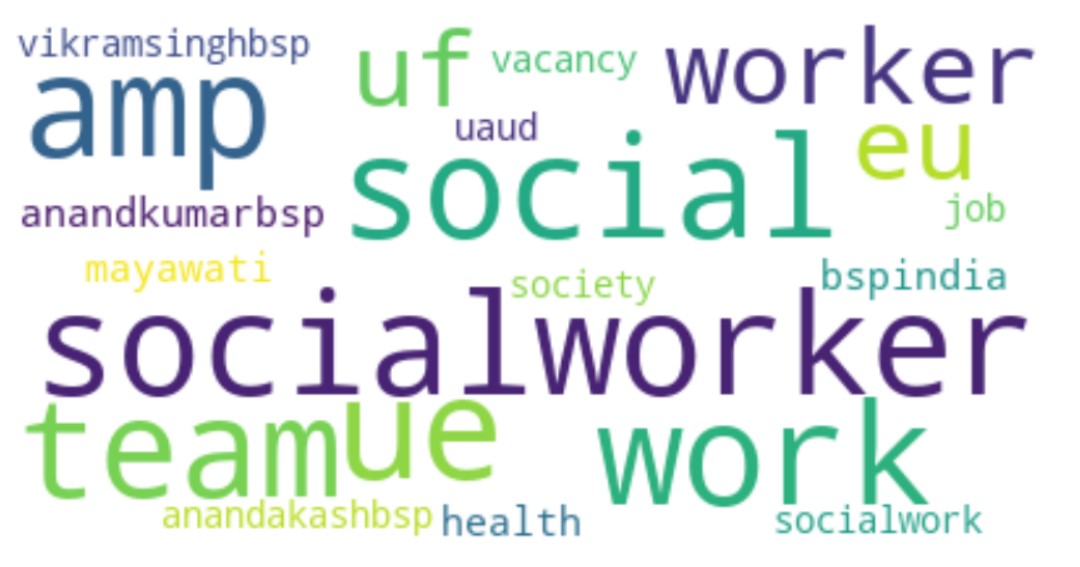
The SVM is created using text dataset in Python.The tweets are extracted on the hashtag "social worker" and hashtag "covid" . The motive behind collecting this text data was to understand the opinion of people regarding social workers and different tweets regarding covid. To get a quick overview of the data, a wordcloud of both the hashtags has been made.
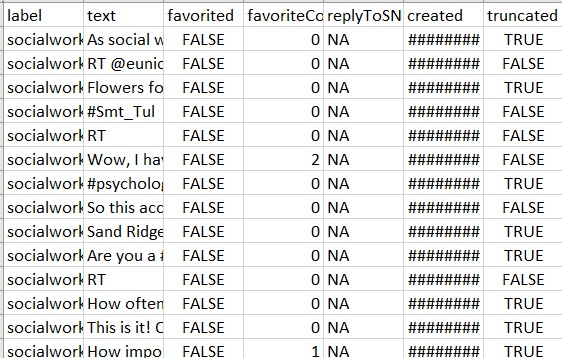
Cleaning and formatting the dataset to the required format
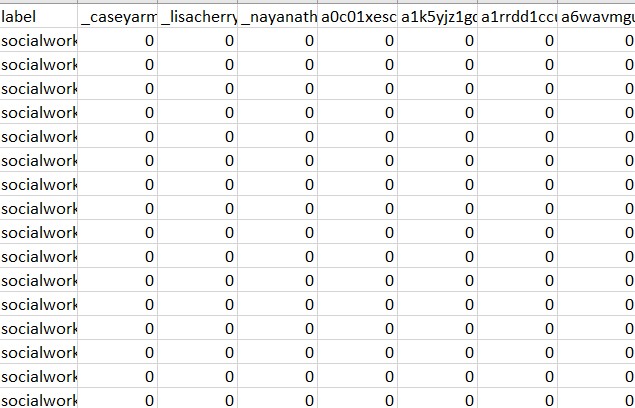
There are a lot of unwated columns in the dataframe. These columns are dropped from the dataframe, retaining only the necessary columns. The stopwords are removed and the text is tokenized, lemmatized and stemmed. Countvectorizer is applied on the data to convert it to numerical format. Checking the balance of the label is very important before performing svm, as unbalanced dataset may lead to over or underfitting.
Model Building
The code to build the model can be found here
Before building the model, the dataset is split into training and testing sets. The split ratio is 0.75 of the total data in the training set and 0.25 data in the testing set. Three different SVM models are created. The SVM models differ due to hypertuning of different parameters. Mainly the cost and kernel. The three types of kernel are polynomial, linear and radial. The cost is selected by tuning it for every kernel and selecting the best cost for each model.
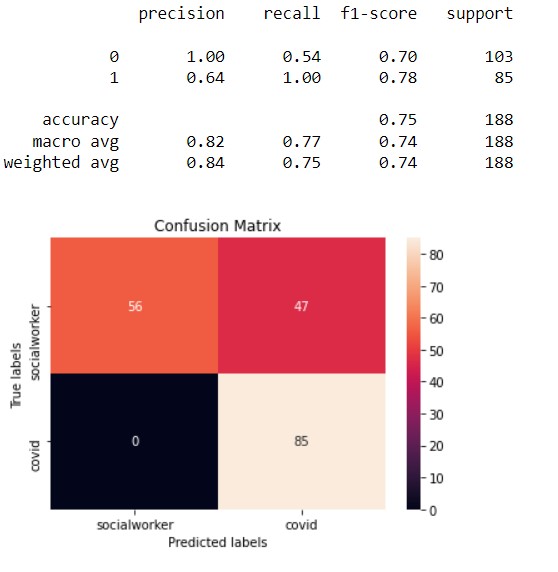
SVM Model 1
This is the first SVM Model. In this model, the kernel is polynomial and the best cost after tuning is 10. The accuracy of this model is 75%.
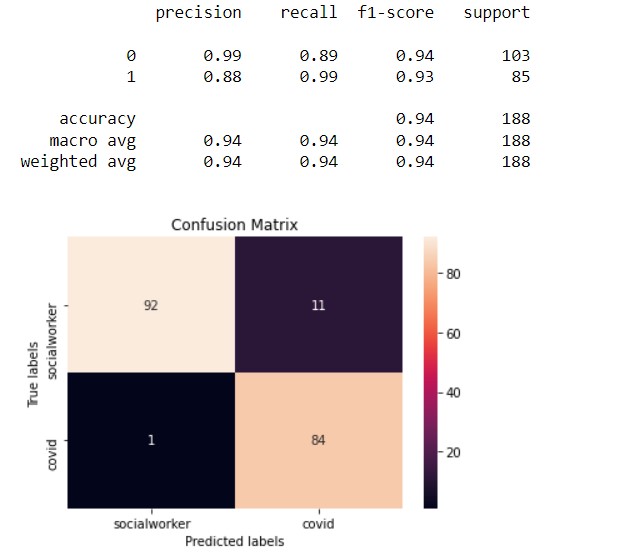
SVM Model 2
This is the second SVM Model. In this model, the kernel is linear and the best cost after tuning is 1. The accuracy of this model is 94%.
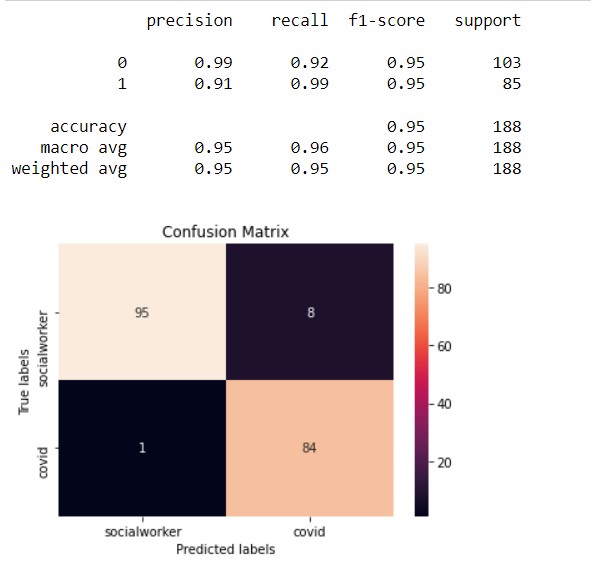
SVM Model 3
This is the third SVM Model. In this model, the kernel is radial and the best cost after tuning is 5. The accuracy of this model is 95%.
Conclusion
The SVM model classified tweets generated from Twitter into the hashtag class (socialworker and covid) of different tweets. The accuracy of the models are in the range of 75-95% which is pretty high in predicting the income group With the collection of words, the model is able to predict or classify the tweets into particular classes. The last model,i.e, the radial model is the best model for this data as it has the highest accuracy (95%). It is the case for both record and text data.